
Not long ago, building a diagram meant dragging boxes across a blank canvas, lining up arrows, and fighting with alignment tools for twenty minutes before you’d even finished the first draft. That process hasn’t disappeared, but it’s no longer the only option.
A new category of tools, often called Diagram AI, lets you type a plain-English description and get a working flowchart, architecture diagram, or mind map back in seconds. You still edit and refine the result, but you’re no longer starting from nothing.
This article breaks down what Diagram AI actually is, how it works, who benefits most from it, and how to choose the right tool for your needs.
What Is Diagram AI?
Diagram AI refers to software that uses artificial intelligence, usually a large language model, to generate visual diagrams from natural language input. Instead of manually placing shapes and connectors, you describe what you want:
- “Show the signup flow for a mobile app, from download to first login.”
- “Draw a three-tier cloud architecture with a load balancer, app servers, and a database.”
- “Create a mind map for a marketing campaign launch.”
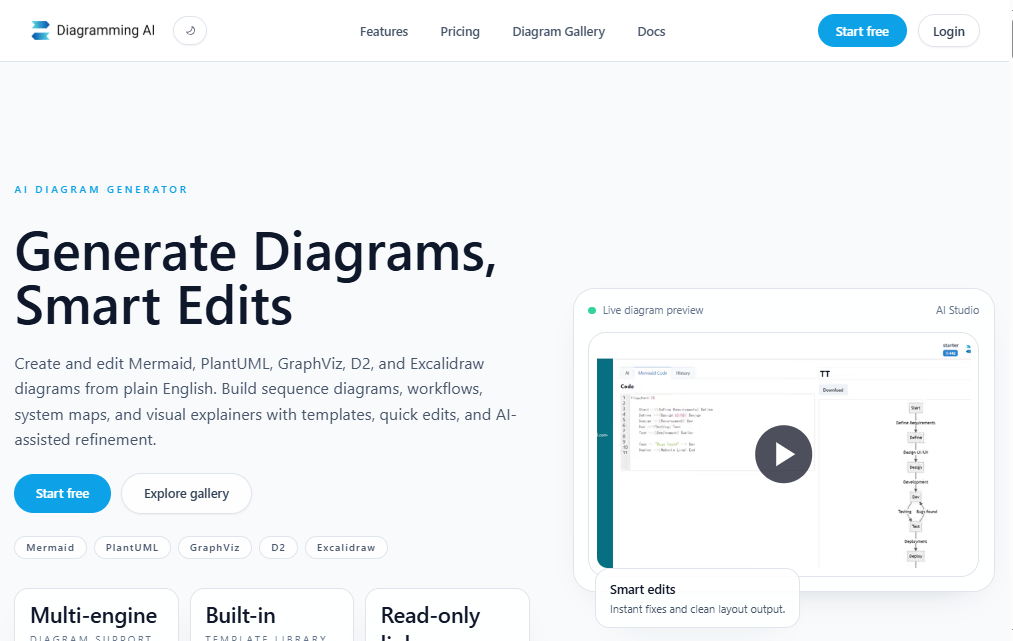
The AI interprets the request, figures out the logical structure, and renders it as an editable diagram. Some tools generate diagrams as visual shapes on a canvas. Others generate them as code, using a diagramming language like Mermaid or PlantUML, which is especially useful for teams that keep documentation in version control.
Why This Matters Beyond “Saving Time”
Speed is the obvious benefit, but it’s not the only one. Diagram AI also lowers the barrier to entry. Someone who has never used a diagramming tool before, and doesn’t know the difference between a swimlane and a sequence diagram, can still get a usable first draft just by describing their process in their own words.
For technical teams, there’s a second benefit: diagrams that live as code can be tracked in Git, reviewed in pull requests, and kept in sync with the systems they describe, rather than going stale in a separate design file nobody remembers to update.
How Diagram AI Tools Actually Work
Most Diagram AI tools follow a similar underlying process, even though the interfaces look different from one product to the next.
- You describe the diagram. This can be a short sentence, a longer paragraph, or even pasted meeting notes or a technical spec.
- The AI extracts structure. It identifies entities (people, systems, steps, components) and the relationships between them (sequence, hierarchy, dependency).
- A diagram is generated. Depending on the tool, this might be a set of editable shapes on a canvas, or text-based diagram code that gets rendered visually.
- You refine the result. You can usually drag elements, change the layout, add labels, or ask the AI to revise specific parts (“add an error-handling step after the payment call”).
Some tools go a step further and can generate diagrams directly from existing content, like a codebase, a document, or a database schema, rather than a manual description.
Common Use Cases for Diagram AI
Diagram AI isn’t a single-purpose tool. It shows up across very different kinds of work.
Software and Systems Documentation
Developers and architects use Diagram AI to sketch out system architecture, API flows, entity-relationship (ER) diagrams, and sequence diagrams. Tools that support diagram-as-code formats like Mermaid are popular here because the diagrams can be embedded directly in Markdown files, wikis, or GitHub repositories.
Product and Process Mapping
Product managers and operations teams use it to map user flows, onboarding journeys, and internal processes. A rough description of “how a support ticket moves from submission to resolution” can become a clear flowchart that’s easy to share with a non-technical audience.
Brainstorming and Planning
Mind maps and concept diagrams help teams organize ideas during early-stage planning. Instead of manually building out branches, you can describe a topic and let the AI propose a starting structure, which you then edit and expand.
Presentations and Reports
Some tools focus specifically on turning written text, like a paragraph from a report or a slide’s speaker notes, into a clean, presentation-ready visual. This is useful for people who need polished output but don’t have design skills or time to spare.
Education and Training
Teachers and trainers use Diagram AI to quickly generate visual explanations of processes, hierarchies, or cause-and-effect relationships, which tend to be easier for learners to follow than blocks of text.
What to Look for in a Diagram AI Tool
Not all Diagram AI tools are built the same way, and the right choice depends heavily on your workflow. Here are the factors worth weighing.
Diagram Types Supported
Some tools specialize in one category, such as flowcharts or architecture diagrams. Others support a broader range, including UML, ER diagrams, network diagrams, and Gantt charts. If you need a specific notation, like BPMN swimlanes for formal process documentation, check that the tool actually supports it rather than approximating it.
Editability After Generation
The AI-generated first draft is rarely the final version. Look at how easy it is to:
- Move, resize, or restyle individual elements
- Add or remove connections without starting over
- Ask the AI to revise a specific section instead of regenerating everything
Diagram-as-Code vs. Canvas Shapes
This is one of the bigger differences between tools. Diagram-as-code tools (built around formats like Mermaid or PlantUML) are text-based, which makes them easy to version-control and diff, but harder to fine-tune visually. Canvas-based tools give you more direct visual control but don’t fit as naturally into a code repository.
Export and Integration Options
Check whether the tool exports to the formats you actually need, such as PNG, SVG, PDF, or native files for tools like Visio. If your team already lives in a specific platform, integration matters more than raw AI quality.
Collaboration Features
For teams, real-time collaboration, comments, and shared workspaces matter as much as the AI generation itself. A brilliant diagram that only one person can edit isn’t very useful for a team process.
Pricing and Free Tiers
Many Diagram AI tools offer a free tier with limited diagrams, exports, or AI generations per month. If you’re testing a tool for the first time, start with the free plan and see whether the output quality matches your needs before upgrading.
A Quick Look at the Diagram AI Landscape
As of 2026, the market includes a mix of AI-first tools built specifically around text-to-diagram generation, and established diagramming platforms that have added AI features on top of their existing products.
- AI-first, diagram-as-code tools are popular with developers who want diagrams that live alongside their documentation and can be tracked in version control.
- Canvas-based AI tools appeal to product and design teams who want a more visual, drag-and-drop editing experience after the AI generates a first draft.
- Established platforms with added AI (the kind many enterprise teams already pay for) tend to offer deeper templates, integrations, and governance features, with AI generation as a shortcut rather than the whole product.
The right pick usually comes down to two questions: what type of diagrams do you make most often, and does your team need version-controlled diagrams or visually polished ones? Trying two or three free tiers side by side, with the same prompt, is often the fastest way to tell them apart.
Limitations Worth Knowing
Diagram AI is genuinely useful, but it’s not magic. A few honest limitations are worth setting expectations around:
- Complex diagrams often need manual cleanup. The AI is good at getting the overall structure right, but layout, spacing, and fine detail usually need a human pass.
- Ambiguous prompts produce ambiguous diagrams. A vague description leads to a vague result. The more specific your input, the better the output.
- Domain-specific notation can be imperfect. Formal standards like strict UML or BPMN notation may need correction, especially for edge cases.
- It’s a starting point, not a replacement for understanding. The tool can visualize a process you describe, but it can’t tell you whether the process itself is correct.
Getting the Best Results From a Diagram AI Prompt
The quality of your output depends heavily on how you phrase your input. A few practical habits help:
- Be specific about entities and order. Instead of “show the checkout process,” try “show the checkout process from cart review, to payment, to order confirmation, including a failed-payment path.”
- Mention the diagram type if you have a preference. Saying “as a flowchart” or “as a sequence diagram” avoids guesswork.
- Iterate in small steps. Rather than rewriting the whole prompt, ask the tool to adjust one part at a time, like adding a decision branch or renaming a step.
- Paste existing text when you have it. If you already have a written process description, a spec, or notes, feeding that in directly usually produces a more accurate diagram than summarizing it yourself first.
Final Thoughts
Diagram AI won’t replace careful, thoughtful diagramming, especially for complex technical documentation where precision matters. But for the everyday work of turning an idea, a process, or a system into something visual, it removes a lot of the friction that used to make diagramming feel like a chore.
If you regularly find yourself avoiding diagrams because building them from scratch takes too long, it’s worth trying a Diagram AI tool on your next project. Start with a simple, well-described prompt, see how close the first draft gets you, and go from there.